
(Updated November 18, 2000)
Business Summary
Applied Materials (AMAT) is the world's largest supplier of products and services to the global semiconductor industries. Applied Materials manufactures systems that perform chemical vapor deposition (CVD), physical vapor deposition (PVD), epitaxial and polysilicon deposition, rapid thermal processing (RTP), plasma etching, ion implantation, metrology, inspection and chemical mechanical planarization (CMP).
Applied Materials is a leading supplier of CVD (chemical vapor deposition) systems used to produce Flat Panel Displays (FPDs). Through its subsidiary Etec, the Company is also a leading manufacturer of mask pattern generation systems. In addition, through its subsidiary Consilium, the Company is the leading supplier of manufacturing execution system (MES) software for semiconductor factory automation.
AMAT's revenues and earnings have grown an order of magnitude over the last decade.
Applied Materials has demonstrated the ability to meet competitor challenges and to gain market share. AMAT is likely to maintain its leadership position as the barriers to entry for competitors are high. Its product is very sophisticated technically, reflecting the cumulative results of years of large research and development budgets. The support of its products requires a large number of support engineers. Thus it is unlikely that there will be new companies started that will challenge their leadership. The competition threat will be pretty much limited to evolutionary changes among the existing competitors.
AMAT is extending its product line through joint ventures and acquistions. It has recently entered the flat panel display manufacturing equipment business, the mask pattern generation business, and the manufacturing execution system software business. AMAT's marketing resources, field support resources, and customer penetration with it's existing lines should give it a competitive advantage in these new fields.
The downside to this business is that it is cyclical. The semiconductor industry has historically been characterized by periodic periods of manufacturing over-capacity and under-capacity.
Drivers
The drivers for semiconductor manufacturing equipment are as follows:
| Demand for semiconductors | |||||||
Technological change
|
Industry Characteristics
| High barriers to entry | |
| Good pricing power due to limited and orderly competition | |
| Cyclical | |
| Participants are segmented according to the steps in the semiconductor manufacturing process that the participant provides equipment for. |
Market Share
 Figure 1 shows ten years of
revenues for the semiconductor industry participants covered by Value Line
Investment Survey regular edition. Clearly Applied Materials is
dominant. It's share of revenues has grown from 35% to over 50%.
Teradyne is the second largest vendor with a 17% market share. Teradyne is
not a competitor to AMAT in that it provides test equipment whereas AMAT
provides wafer fabrication equipment. No other vendor accounts for as much
as 10% share.
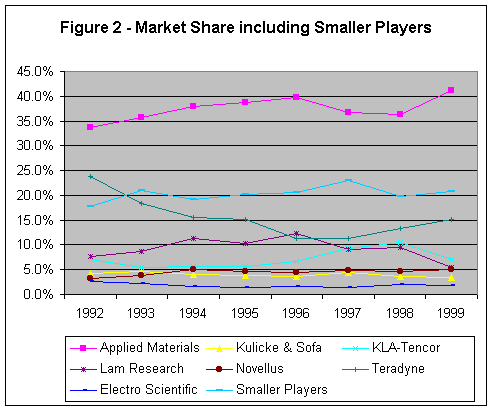
  Figure 2 shows similar data including the companies covered
in the Value Line Expanded Edition, the smaller companies. Eight years of
data is shown. The smaller companies combined have captured a fairly
consistent 20% of the industry revenues. AMAT grew from a 34% to a 42%
market share. AMAT estimates that they
have a 28.7% of the total Wafer Fab Equipment market including global.
competitors.
Growth Trends
 Figure 3 shows AMAT's revenue
growth. The growth has compounded at an average rate of 24% over the last
ten years. The growth is not steady. It is subject to periods of
over capacity and under capacity in the semiconductor industry, and to economic
conditions. The growth was flat starting in 1996 due to overcapacity and
remained flat until 1999 due to the 1998 global liquidity crisis which affected
the Asian business climate. Exceptional growth is being experienced in 2000,
probably due to pent up demand from lack of investment in the prior years.
AMAT has provided analysts guidance that 2001 revenue growth is expected to be
28% (St.
Louis Society of Financial Analyst Presentation).
Semiconductor Demand
AMAT expects semiconductor annual revenue growth through 2004 to be nearly 20%. They cite Dataquest as the source for this estimate. Although PC usage will be flat in comparison to the last five years, they anticipate much stronger demand in communications, consumer devices and servers and workstations.
Technology Driven Demand
| 300mm wafer size - AMAT received the first significant orders for this equipment in 3Q00. They expect to start recognizing revenue in 1Q01. They are optimistic that they will capture additional market share with this line of equipment. This is a long term effort; typically pilot lines in 2001, first production lines in 2002, and volume production in 2003. | |
| Copper Interconnects - This again is in an early stage of development. However, AMAT expects to see the use of copper accelerate in the next three years, becoming the dominant technology by 2003. AMAT hopes to gain market share with this transition. |
Earnings Projections
AMAT executives briefed analysts that they expect semiconductor equipment industry growth to be 28% in 2001 (St. Louis Society of Financial Analyst Presentation). Based on these numbers, I project 2001 earnings to be $2.86, a 21% increase over my 2000 estimate of $2.36 (AMAT projected income statement). This may well be a conservative projection as the revenue rate worked out to be just over $3B per quarter, not much over the projected 4Q00 rate. Value Line's estimate as of July 21, 2000 for 2001 is $3.45. First Call's estimate as of September 13, 2000 is $3.55. Given that my projections do not account for gains in market share nor for above average increases due to the new product lines, I feel that the Value Line and First Call estimates are reasonable.
Caution: Cyclical Nature of the Industry
 Revenue and earnings growth in
this industry are erratic. Figure 4 shows that AMAT's revenue growth oscillates wildly. Earnings growth appears to be dependent
on revenue growth. Flat revenue seems to be accompanied by declining
earnings (Figure 5).
Price
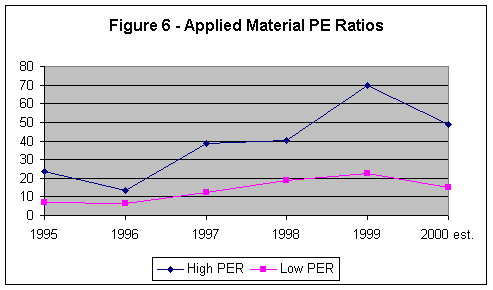
 The average PE ratio over the last five years has been from 13.4 to 37.1
based on the then current year earnings. This ratio has drifted higher
over the years (Figure 6). It was 7.2-23.4 in 1995 and 22.6-69.7 in 1999. As of
November 17, 2000, the stock price is in the low 40's, about 17.5x 2000
earnings of $2.39, 14.7x my estimated 2001 earnings and 11.8x First Call's estimated 2001
earnings. At these prices, the PE ratio would be lower than the 1999 or
2000 lows;
therefore, I believe that the current price in the low 40's makes for a good buy.
No of Visitors:
![]()